SQL query alerts, in QueryFlow's terms
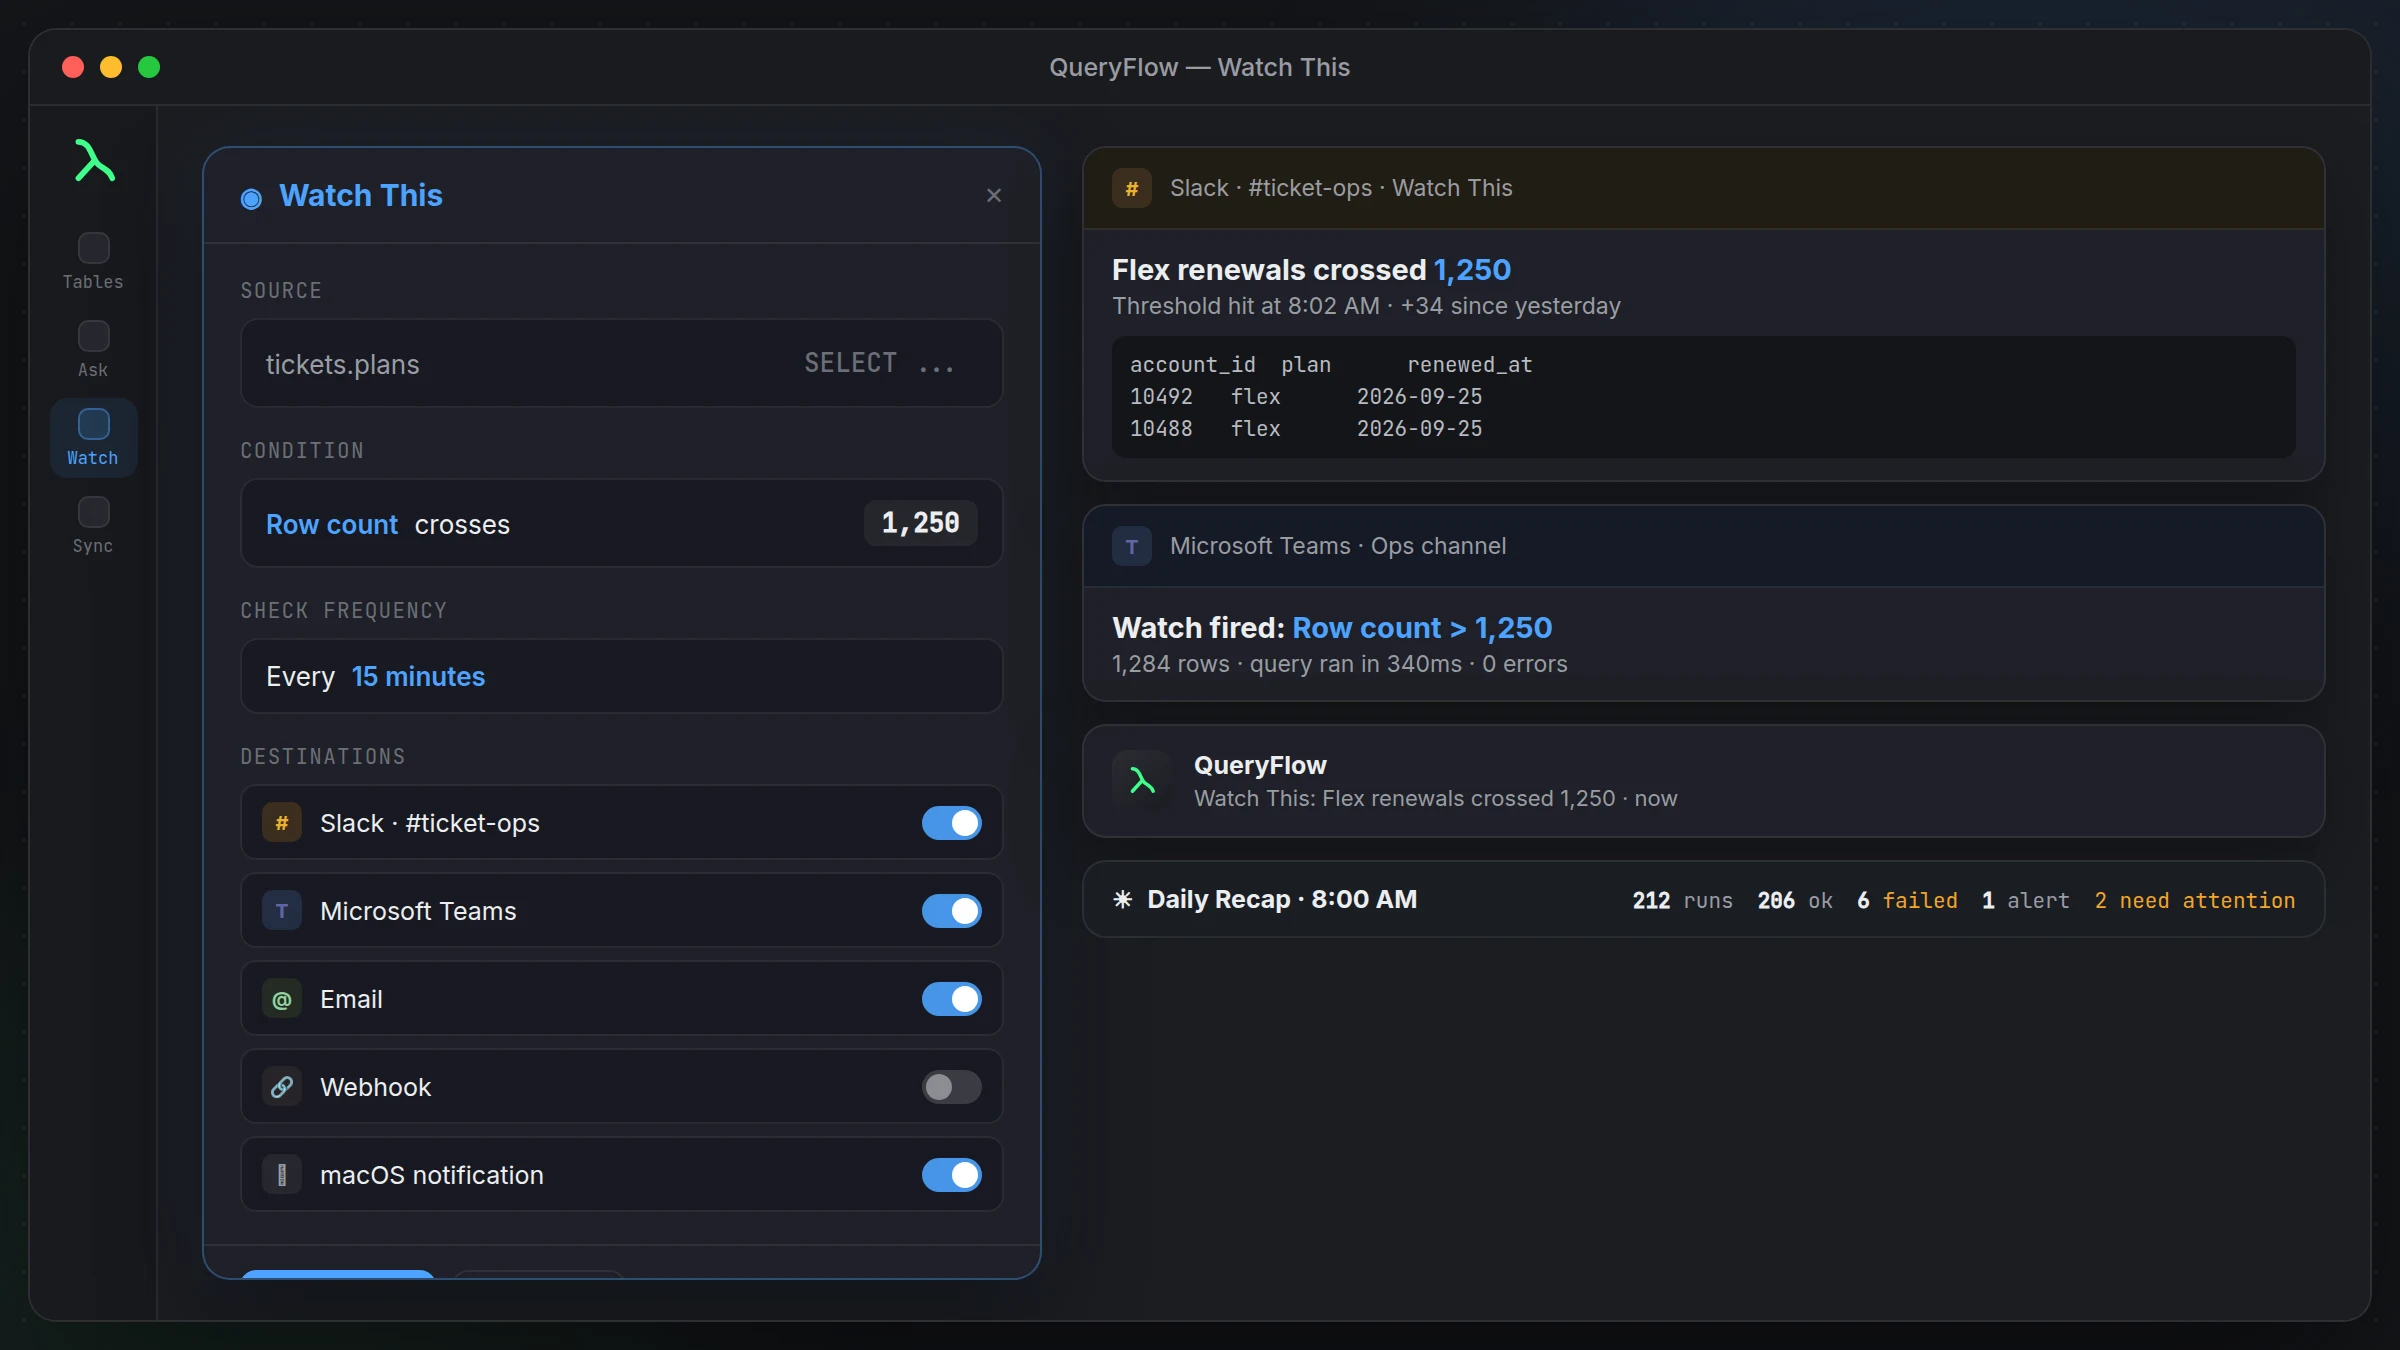
People search for "SQL query alerts" and "row count alerts" using slightly different words for the same need: hear about a number the moment it changes, instead of checking it by hand. In QueryFlow that need is Watch This. Pick what to watch, Row count, A value, or Any change, a Condition (Changed, Greater than, Less than, Equals, Increased by, Decreased by), and a Check every interval from 5 minutes to a day. See how Watch This works for every field explained, or jump to a narrower guide: row count alerts, threshold alerts, or sending an alert to Slack.
The problem it solves
Every data person has a mental list of numbers they check out of habit. Did the row count on a table look right this morning. Is a KPI still above the line where someone gets paged. Did a sync job actually run. That list lives in your head, which means it only gets checked when you remember to check it, usually right after something's already gone wrong.
Watch This moves that list out of your head and into QueryFlow. Attach it to any query result, from any connected database, or to an Ask panel answer, and QueryFlow checks it on the schedule you set. You only hear about it when the condition you defined actually fires, not on every check.
Three kinds of trigger
Row count change: the number of rows a query returns goes up, down, or changes at all since the last check. Useful for "did this table get new rows today" or "did a job that should insert exactly one row do exactly that."
Value change: a specific value in the result changes. Useful for tracking a single number, like a status flag or a daily total, rather than a whole result set.
Threshold crossed: a value goes above or below a number you set. Useful for the classic case, alert me when failed logins exceed 100, or when available inventory drops under 10.
A worked example
Say you run a Postgres-backed SaaS product and want to know if churned accounts spike in a given day:
SELECT COUNT(*) AS churned_today
FROM public.subscriptions
WHERE status = 'canceled'
  AND canceled_at::date = current_date;
Set the threshold at, say, 15, checked every few hours. On a normal day nothing happens. The day churn spikes past 15, you get a Slack card with the count, when it ran, and enough context to decide whether it's noise or something you need to act on before end of day.
Destinations
macOS notifications round it out for watches you only care about on your own Mac. Use Send test message on a new Slack or Teams destination before you trust it.
Keeps running when your laptop lid is closed... well, when the app is
Turn on the login-item helper and watches keep running with the QueryFlow window closed, as long as your Mac itself is on and you're logged in. All your active watches and scheduled jobs live together in one Automations list, one place to see everything that's set up to run on its own.
The Daily Recap
Turn on the Daily Recap and get one message in Slack or Teams every morning: how many jobs ran, how many succeeded or failed, which watches fired overnight, and what needs your attention. See the Daily Recap in detail for what it actually includes.
What it isn't
Watch This checks on an interval you choose, it isn't a streaming trigger and it won't catch something that happens and resolves entirely between two checks. It's built for the "did this number move" class of alert, not for sub-second production monitoring.
Setting up your first watch, step by step
Run the query you want to keep an eye on. Click Watch This on the result. Pick the trigger type, row count, value, or threshold, and set the specifics, like which value to track or where the threshold line sits. Pick a destination, or more than one, Slack and a macOS notification together is a common combination for something you want to see both on your phone and in the team channel. Set a check interval that fits how quickly the thing you're watching can change. Send a test message if you picked Slack or Teams, then save it. It runs from there without further attention until the condition fires.
A second worked example: watching for silence
Row count change isn't only for catching spikes, it's also good for catching a job that's gone quiet. If a table is supposed to get new rows every hour and a watch is set to alert on any row count change, a job that's stopped running entirely shows up just as clearly as one that's suddenly inserting way too many rows. That's a distinction a fixed threshold alone might miss, since "zero new rows" and "the threshold wasn't crossed" can look the same if you're only watching for too-high.
How this fits with scheduled jobs
Watch This and the Scheduler solve related but different problems. A scheduled job runs and delivers a result every time, on a fixed cadence, which is right for a report someone reads regularly regardless of what it says. A watch only speaks up when its condition fires, which is right for the things you'd otherwise be checking manually just in case. Most setups end up using both: a daily scheduled report for the numbers people expect to see, and a handful of watches for the specific conditions that actually need attention when they happen.
A note on webhooks
If Slack, Teams, and email don't cover your case, the webhook destination sends the same alert payload to any URL you configure, which is the escape hatch for piping watch alerts into something else entirely, an internal dashboard, a paging tool, a custom script. It's the least polished destination visually since there's no card to render, but it's the most flexible one.