From a BigQuery result to a standing watch
You already have queries you run out of habit: how many orders came in overnight, whether a sync job's row count looks normal, whether a KPI crossed a line someone cares about. Watch This turns any of those, or an Ask panel answer, into something QueryFlow checks for you instead of you remembering to run it.
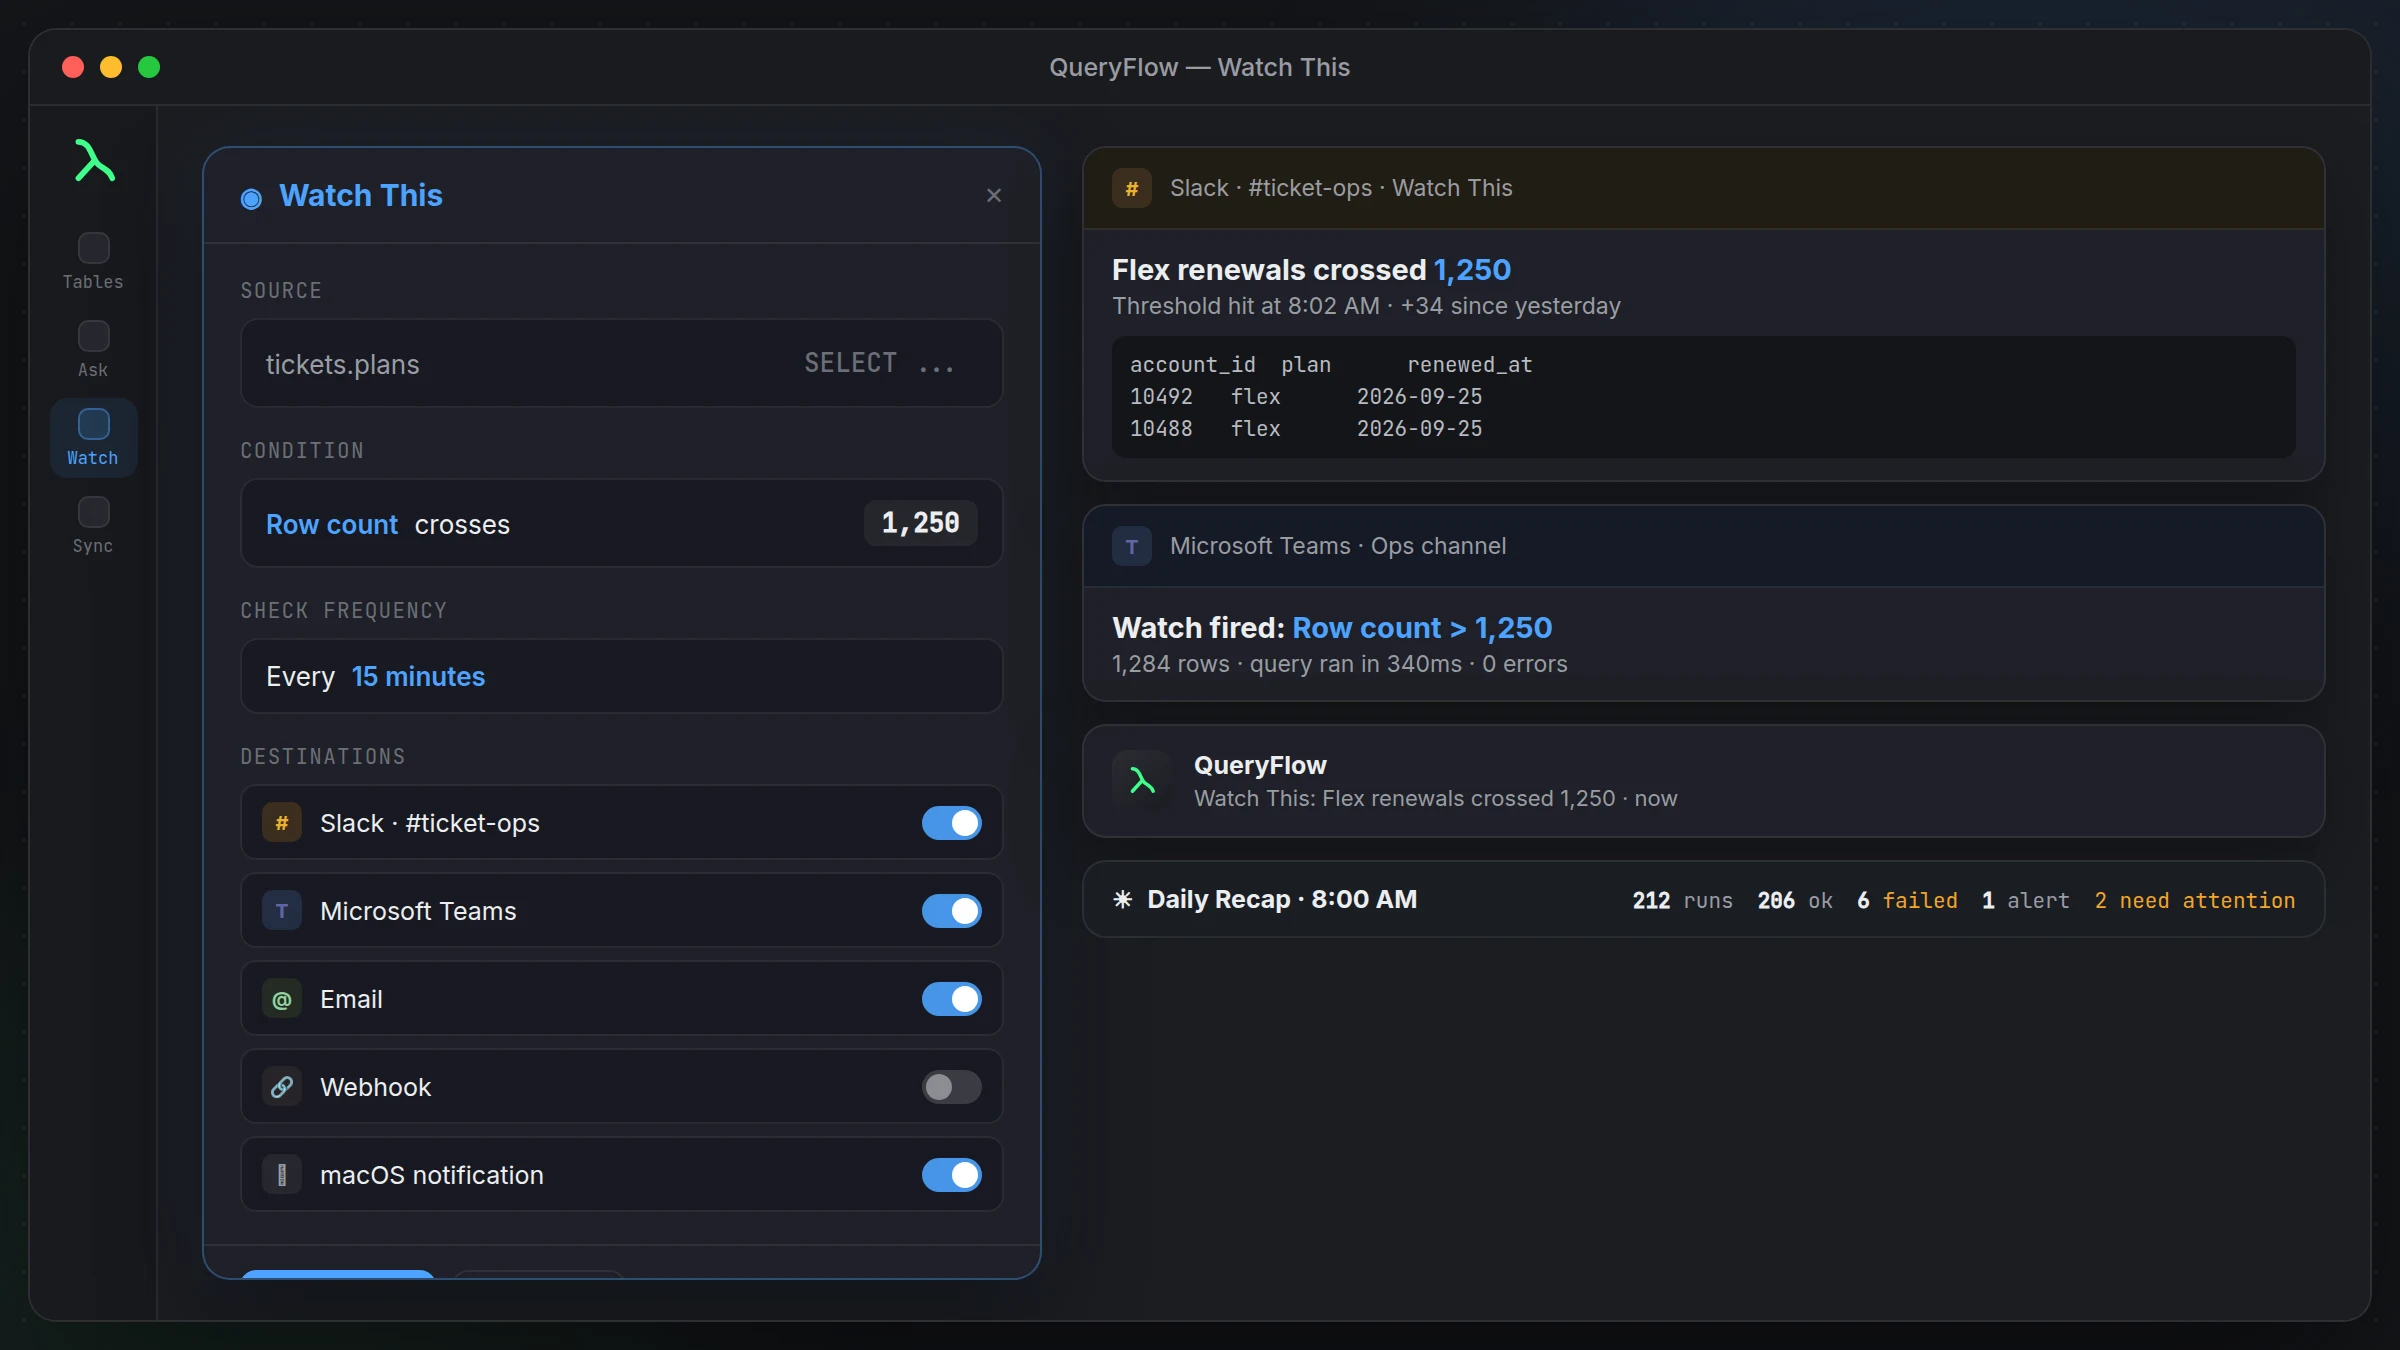
Run the query against your BigQuery connection, click Watch This, and pick what counts as a change: the number of rows returned going up, down, or just changing at all; a specific value changing; or a value crossing a threshold you set, above or below it.
A worked example
Say you want to know if failed checkout events spike. You write:
SELECT COUNT(*) AS failed_checkouts
FROM `acme-warehouse.events.checkout_failures`
WHERE event_time >= TIMESTAMP_SUB(CURRENT_TIMESTAMP(), INTERVAL 1 HOUR);
Watch this with a threshold of, say, 50, checked hourly. If the count stays under 50, nothing happens and you don't get a message. The moment it crosses 50, Slack or Teams gets a card with the count, when it ran, and a link back into the result, so the first thing you see about the spike is in the channel you're already watching, not a dashboard you have to remember to open.
Destinations
macOS notifications are also available for watches you only want to see on your own machine. Connect your Slack workspace or Teams channel once, then use Send test message to confirm the card looks right before you rely on it for anything real.
What lands in the card
Job completion cards in Slack and Teams include the row count, how long the check took to run, a preview of the first 10 rows, and any errors. That's usually enough to decide whether something needs your attention right away or can wait until you're back at your desk.
Runs while your Mac is on, app closed
Turn on the login-item helper and watches keep firing even with the QueryFlow window closed, as long as your Mac is on and you're logged in. Every active watch sits in one Automations list alongside your scheduled jobs, so you can see everything that's running without hunting through separate screens.
What this doesn't cover
Watch This checks on a schedule, it isn't a streaming or real-time trigger, so a spike that happens and resolves entirely between checks can slip through. If you need true real-time alerting on BigQuery data, this is a good complement but not a replacement for a dedicated streaming pipeline.
Watching an Ask panel answer instead of a query you wrote
You don't need to hand-write the SQL to set up a watch. Ask the panel a question, get an answer you trust, and click Watch This on that result the same way you would on a query you wrote yourself. This is useful when the underlying condition is a little more nuanced than a single COUNT, letting the Ask panel work out the right query once, then watching that exact query going forward.
Choosing a sensible check interval
BigQuery bills by data scanned, so checking a watch every minute against a large table isn't free, and it's usually unnecessary. Match the interval to how fast the thing you're watching can actually change: an hourly check is plenty for daily order volume, but a threshold on live error rates during a deploy window might justify checking every few minutes for that one afternoon, then dialing it back down afterward. There's no universal right answer here, it depends on the query and what it scans.
Combining a watch with the Daily Recap
Individual watches tell you the moment something crosses a line. The Daily Recap, if you turn it on, gives you the quieter version: a once-a-day summary of which watches fired overnight alongside your scheduled job results. Most teams end up using both, urgent watches for things that need same-day attention, the recap for a calmer morning check that nothing slipped through. See the Daily Recap in detail for what that message actually includes.
Starting with one watch, not ten
It's tempting to set up a watch on everything the first week you have this. Resist it. Start with the one or two numbers you already check manually out of habit, get comfortable with how the alerts feel in practice, and add more once you know your thresholds are set sensibly. A dozen watches with badly tuned thresholds just becomes noise you learn to ignore, which defeats the purpose.
Watching alongside your existing BigQuery monitoring
If your team already has query-level monitoring or a cost dashboard for BigQuery, Watch This isn't meant to replace it. Think of it as a lightweight layer for the specific business-facing conditions people actually ask about in Slack, not a substitute for infrastructure-level observability your data platform team might already run.
One more thing worth setting up
Pair a watch with the Ask panel when you're not sure what query to write in the first place. Ask "how do I know if checkout failures are spiking" and let the panel propose the query, then watch that instead of guessing at the SQL yourself. It's a small workflow, ask, verify, watch, but it covers the whole path from a vague concern to an actual standing alert.
Beyond alerting: syncing the same query's output
A watch tells you when something changed. As of 1.7, if you'd rather also land that result in a table, BigQuery is a Data Sync target and a job destination too, Insert, Update, Upsert, or Append and Replace. Watch This and Data Sync are separate features that can point at the same query, one alerts, the other writes. See the Watch This tutorial.
Worth a try the next time you catch yourself wondering whether something should be watched but aren't sure how to phrase the query.