The queries you already run out of habit
Most teams on Databricks have a handful of queries someone runs by memory: did the overnight job land, is a table's row count where it should be, did a pipeline's error rate jump. Watch This turns one of those into something QueryFlow checks for you, so the habit becomes a system instead of a task on your mental list.
Run the query, click Watch This, and pick what should count as a change: the row count going up, down, or changing at all; a specific value changing; or a threshold crossed, above or below it.
A worked example
Say a nightly job loads a fact table and you want to know if it silently ran short. You write:
SELECT COUNT(*) AS rows_loaded
FROM ops.gold.daily_orders
WHERE load_date = current_date - interval 1 day;
Watch this with a threshold of, say, 5000 rows minimum, checked once each morning. If the count comes in low, that usually means the upstream job partially failed, and you want to know before your dashboards quietly show a dip nobody explains. Slack or Teams gets the card the moment the check runs, with the count, the run time, and a link back to the result.
Destinations
macOS notifications are also available for watches you only want to see on your own Mac. Connect your Slack workspace or Teams channel once, then use Send test message before you rely on it for anything that actually matters.
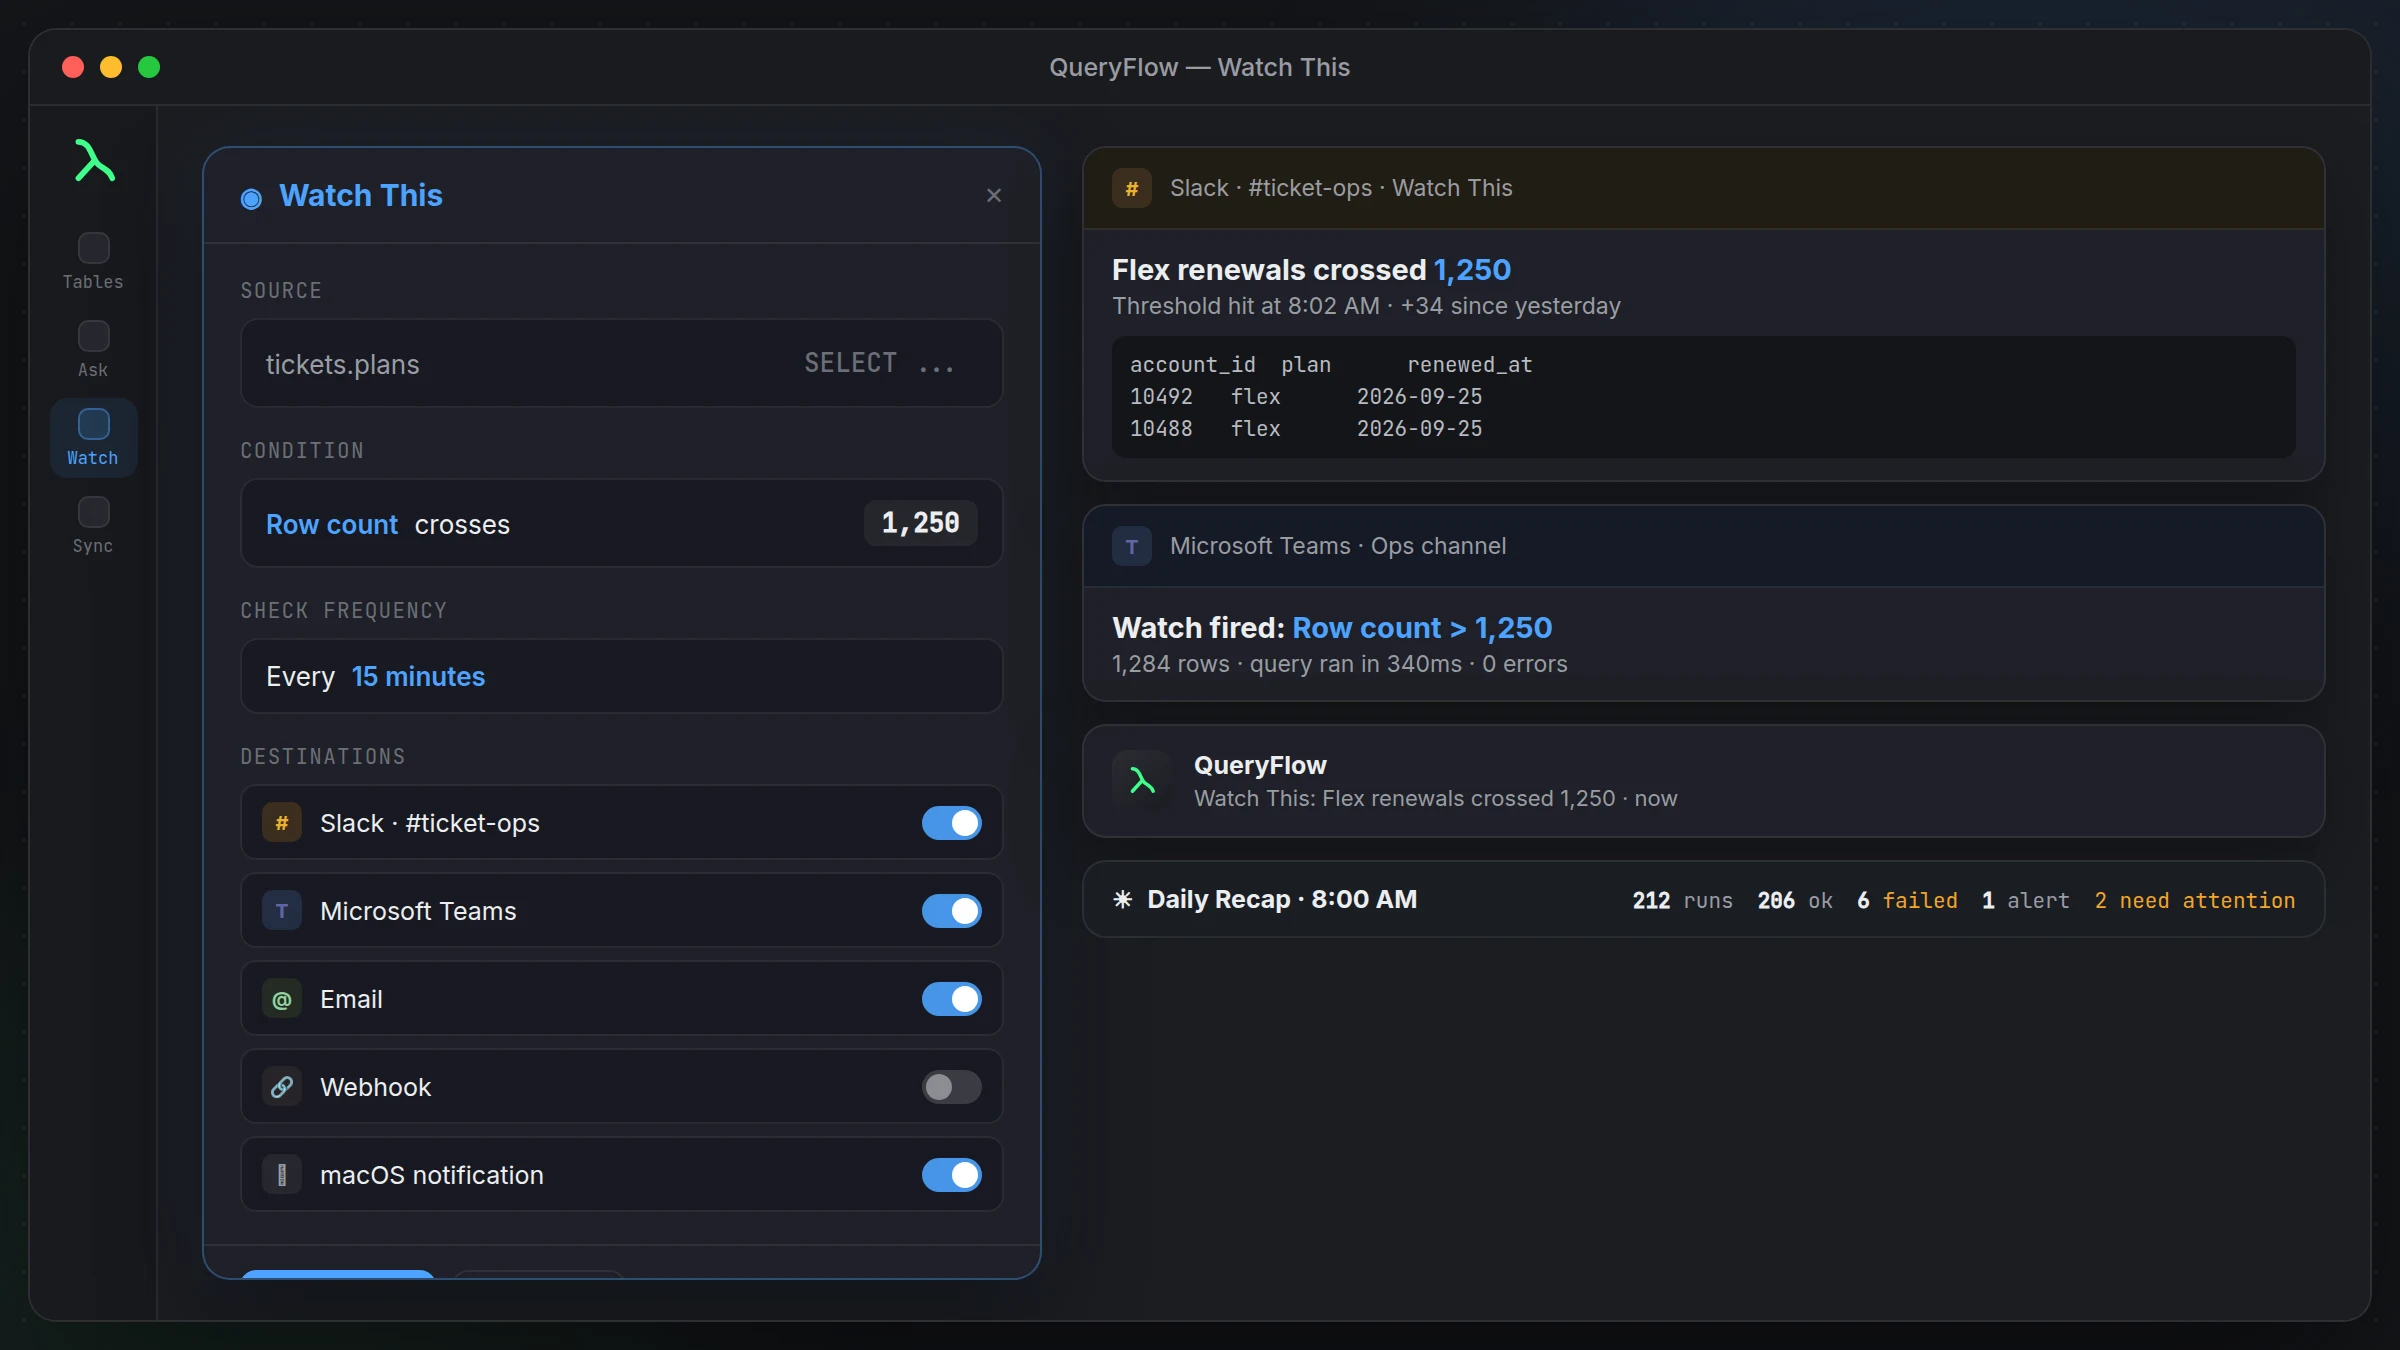
What lands in the card
Job completion cards include the row count, run duration, a preview of the first 10 rows, and any errors. Enough to decide, from inside Slack, whether you need to open QueryFlow or the day can go on as planned.
Runs with the app closed
Turn on the login-item helper and watches keep firing with the main QueryFlow window closed, as long as your Mac is on and you're logged in. Watches and scheduled jobs sit together in one Automations list, so nothing running is hidden in a separate screen you forget to check.
Where this falls short
This checks on a schedule you set, it isn't a real-time streaming alert. A job that fails and gets manually rerun within the same check window might not trip the watch at all. For genuinely time-sensitive alerting on a production pipeline, pair this with whatever monitoring your data platform already runs, don't replace it outright.
Watching an Ask panel answer
You can watch a question instead of a query. Ask the panel something like "how many jobs failed in the last run" and click Watch This directly on that answer. This is handy when the exact SQL behind a check is fiddly enough that you'd rather let the panel work it out once and then keep watching the same query it settled on.
A second example: watching for silence, not just spikes
Not every useful watch is about a number going too high. Sometimes the concerning case is a number going to zero when it shouldn't. If a job is supposed to insert a handful of rows every hour, a row-count watch set to alert on any change catches both a spike and a job that's quietly stopped running, which a single fixed threshold might miss in one direction.
Setting a sensible check interval
Match the check frequency to how fast the thing can actually change and how expensive the query is to run repeatedly. A nightly load only needs a once-a-day check. Something you're actively worried about during a specific window, a migration, a big marketing push, is worth checking more often for that window and dialing back down once things settle.
Combining it with the Daily Recap
A single urgent watch and a once-a-day recap solve different problems. The watch tells you the moment a threshold crosses so you can act same-day. The recap, if you turn it on, gives you a calmer morning summary of every watch that fired overnight next to your scheduled job results, so you're not piecing that picture together from a dozen separate Slack or Teams messages. See the Daily Recap in detail for what it actually includes.
Start small
Set up one or two watches on the numbers you already check by habit before adding a dozen more. It's easier to trust a small number of well-tuned watches than to sift through noise from thresholds you set too aggressively on day one. Add more once you've seen how the first ones behave in practice.
Alongside whatever monitoring your platform team runs
If your Databricks workspace already has job-level alerting or a monitoring tool watching pipeline health, this isn't meant to replace it. It's a lighter layer for the business-facing numbers people ask about directly, row counts, specific values, thresholds someone cares about, not a substitute for infrastructure monitoring a platform team already owns.
Pairing it with the Ask panel
If you're not sure what query to watch in the first place, ask the panel. Something like "how would I know if the nightly load ran short" gets you a proposed query, which you can then verify and turn into a watch. That path, ask, check, watch, covers the distance from a vague worry to an actual standing alert without you writing SQL from scratch.
Beyond alerting: syncing the same query's output
A watch tells you when something changed. As of 1.7, if you'd rather also land that result in a table, Databricks is a Data Sync target and a job destination too, Insert, Update, Upsert using MERGE on a key column, or Append and Replace. Watch This and Data Sync are separate features that can point at the same query, one alerts, the other writes. See the Watch This tutorial.
It's a quick habit to build and it tends to stick once you've used it once or twice.