What "data freshness" actually means day to day
The failure mode people are usually worried about isn't bad data, it's silent data: a scheduled job that used to run every night quietly stops, a source API starts returning empty responses, an upstream table gets truncated and nothing downstream ever gets refilled. Nobody notices until a dashboard looks wrong three days later and someone has to trace it back. A freshness check exists to catch that gap the same morning it happens.
Where the "observability platform" category comes from
Tools like Monte Carlo and Metaplane built entire categories around this problem at scale: automatic table-level monitoring across a whole warehouse, schema change detection, lineage tracking, anomaly detection tuned per table. For a data platform team responsible for hundreds of tables and dozens of pipelines, that scale and automation earns its cost. For a team watching a handful of tables that actually matter, that's a lot of platform for the job.
A worked freshness check on Databricks
Say you have a nightly ingestion job that should land new rows in a Unity Catalog table by 6 AM. The check:
SELECT COUNT(*) AS rows_today
FROM main.ingestion.orders_raw
WHERE ingested_at >= current_date();
Run this against your Databricks connection in QueryFlow, click Watch this, choose A value on rows_today, condition Equals 0 (a stronger signal than "any decrease," since zero specifically means nothing landed at all), check every 1h starting at 6 AM, destination Slack. If the job silently failed overnight, you get a message before anyone downstream notices the dashboard looks off.
A variant using a timestamp instead of a count
If the table gets sporadic updates rather than a predictable nightly batch, checking the most recent timestamp is often a better signal than a row count:
SELECT DATEDIFF(hour, MAX(updated_at), CURRENT_TIMESTAMP()) AS hours_stale
FROM main.ingestion.orders_raw;
Watch hours_stale with condition Greater than a threshold like 6, checked every hour. This catches a table that's technically still getting some rows, but far fewer, or far later, than it should.
What this approach doesn't do
It doesn't discover which tables matter for you, catalog every table's health automatically, detect schema drift, or trace lineage back to a root cause across dozens of pipelines. You pick the tables, write the checks, and set the thresholds yourself. For a small number of genuinely important tables, that's a reasonable trade for skipping a platform's setup and license cost. For a large organization that needs automatic coverage across hundreds of tables without anyone hand-picking them, a dedicated observability platform is doing a job this approach isn't built for.
Setting one up
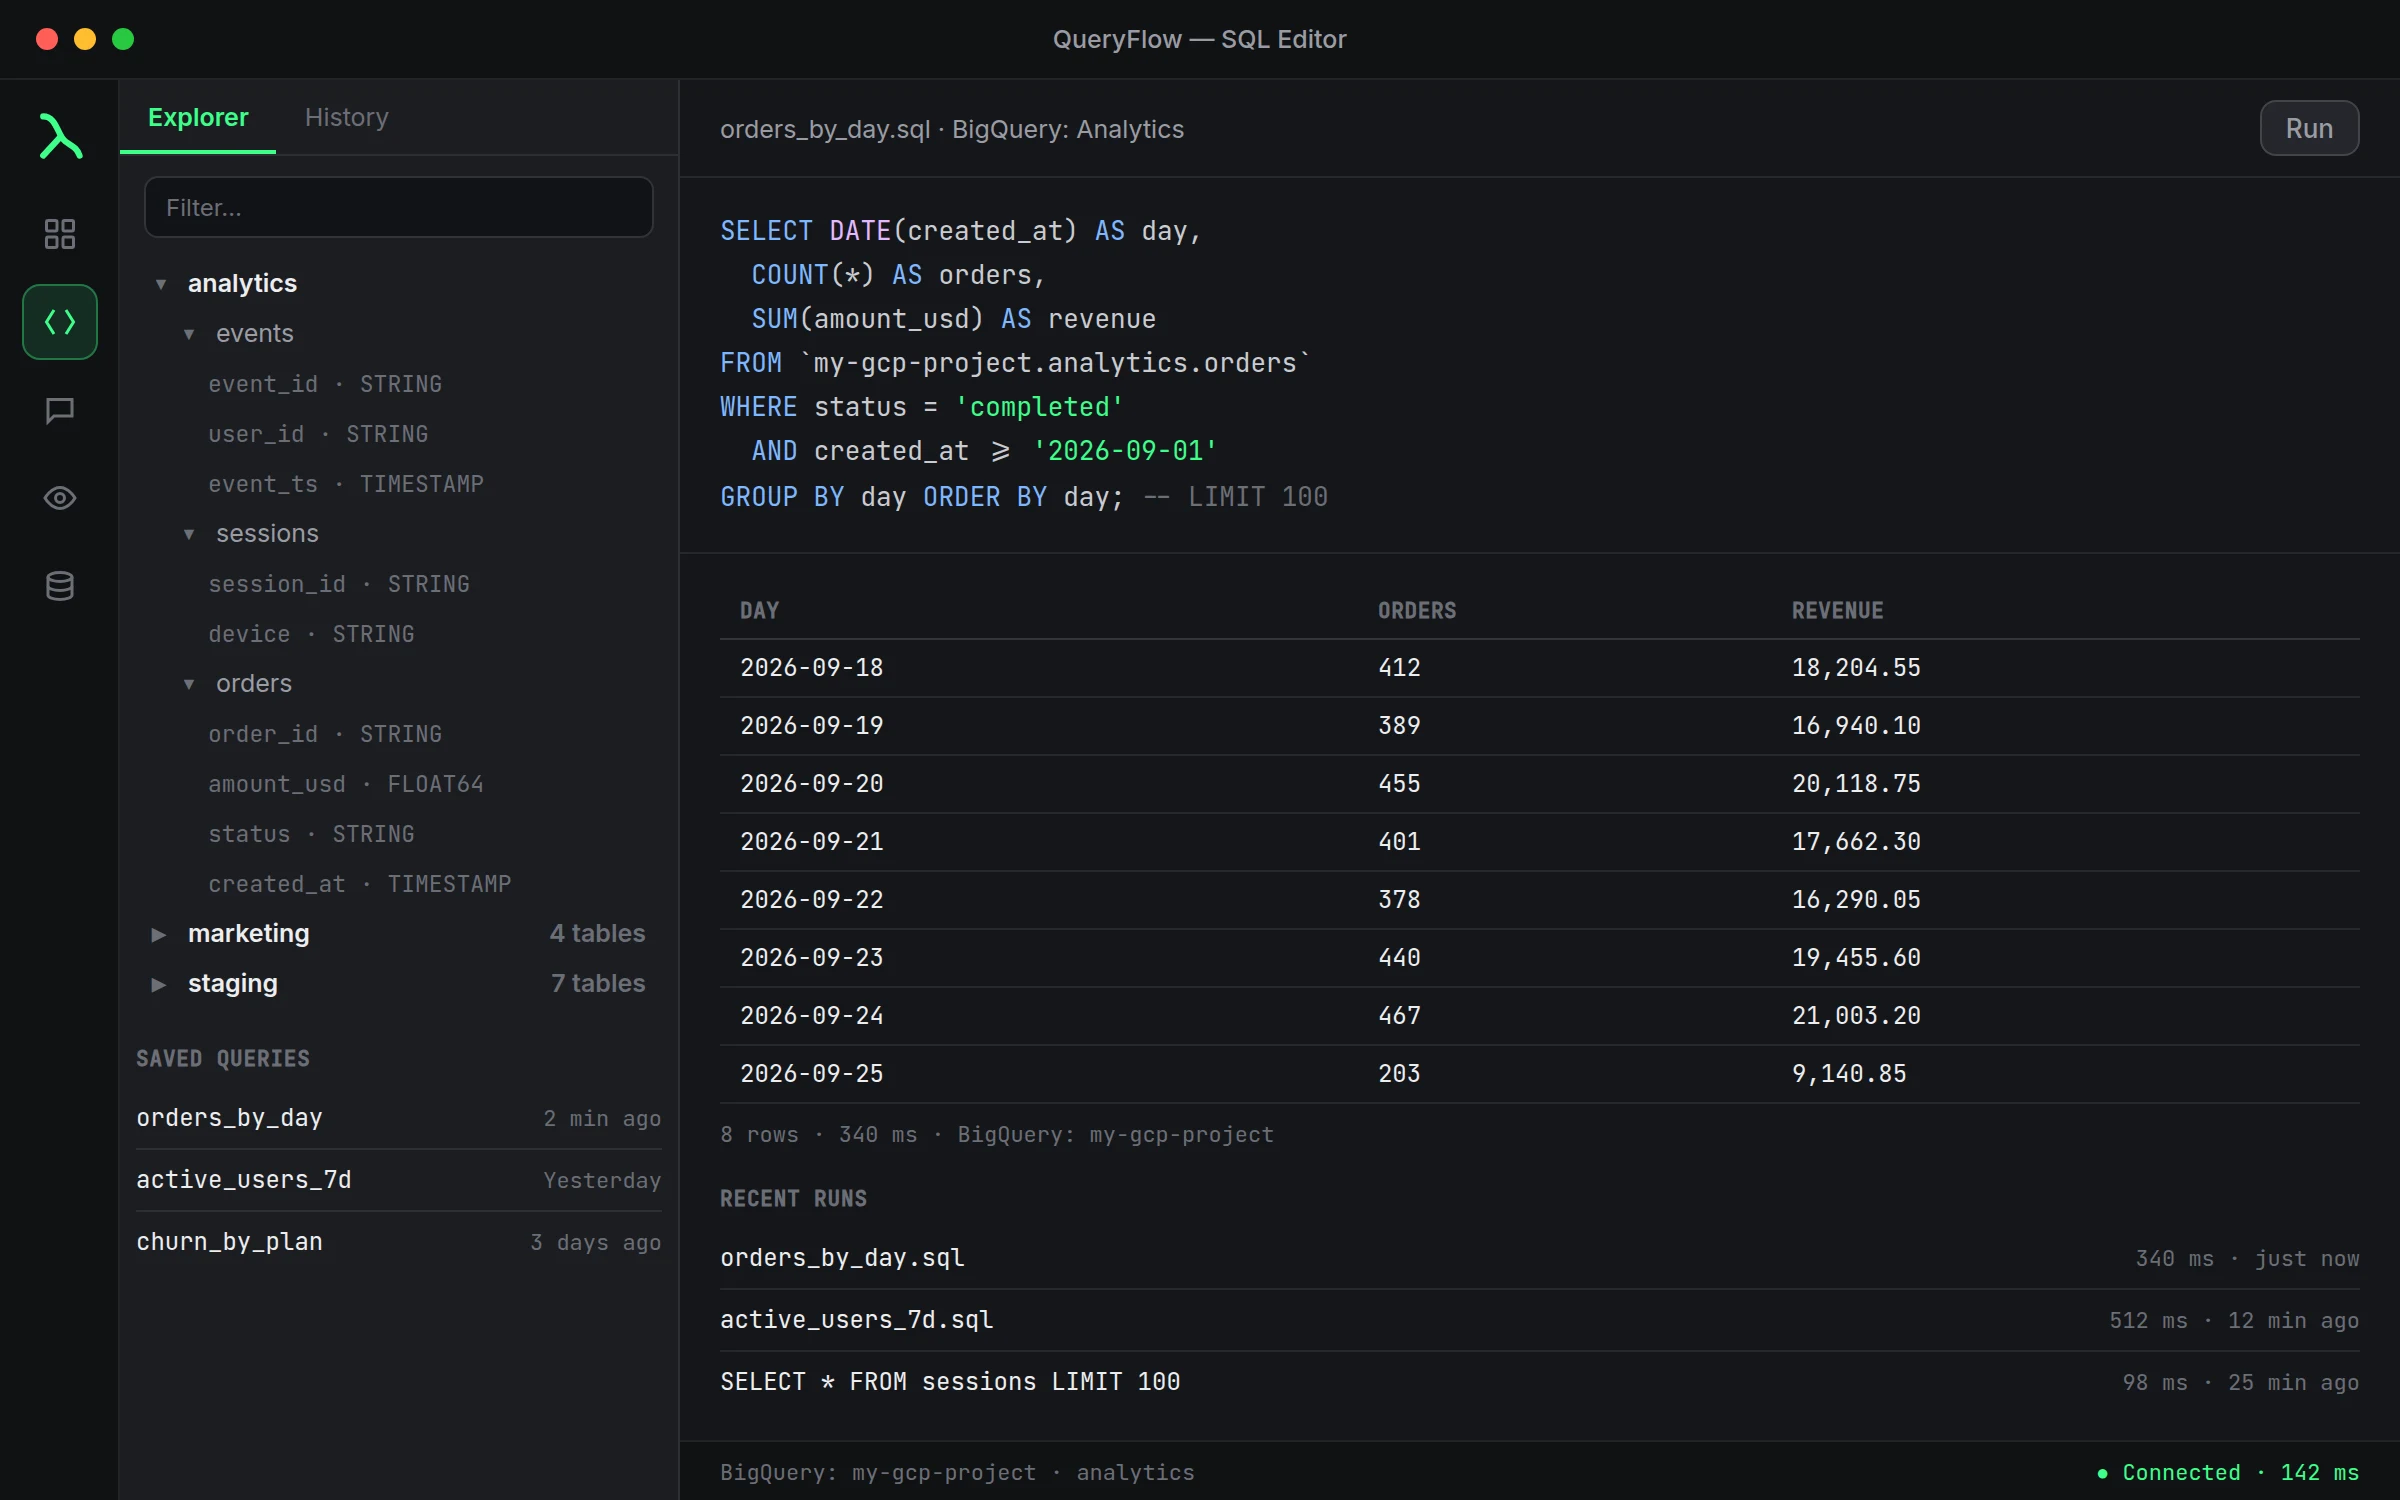
Run your freshness query, click Watch this, name it, confirm the connection and SQL, choose what to watch and a condition, set Check every, tick your destinations, then Run preview and Save. On Pipelines, turn on Run Jobs When App Is Closed in Settings → Scheduling so the check keeps running with QueryFlow shut. Full steps: the Watch This tutorial.
Picking the right check interval
A freshness check's interval should roughly match how often the table is supposed to change, checked slightly more often than that so you catch a miss close to when it happens rather than a full cycle later. A table that updates hourly is worth checking every hour; a nightly batch job is better checked once, an hour or two after it should have finished, than every fifteen minutes, since checking too often just means seeing "not yet" until the batch actually completes. QueryFlow's Check every options run from 5m up to 1d, wide enough to match either pattern.
Watching several tables without several tools
Once the first freshness Watch is set up, adding a second on a different table, or a different warehouse entirely, is the same few clicks, not a new integration to wire up. A team with three or four tables that genuinely matter, a daily orders load, an hourly events stream, a weekly finance export, can cover all three with three Watches on their existing connections, each checked on its own interval, each notifying its own channel if that's useful, without any of them needing a shared platform underneath.