Before you start
You need a connection that has actually failed a Test. The Diagnostics panel only has something to show once a test has run and come back red.
The six stages
The panel runs the same six stages for every provider, in this order, and stops at the first one that fails, so nothing below it is meaningful yet.
| Stage | What it checks | A fail here usually means |
|---|---|---|
| DNS resolve | Can the hostname be turned into an IP address at all. | A typo in the hostname, or a private host that needs a VPN you're not connected to. |
| TCP reach | Can a network connection actually open to the host and port. | A firewall, security group or IP allowlist is blocking you, or the port is wrong. |
| TLS handshake | Does the SSL/TLS negotiation succeed. | An SSL mode mismatch, or a certificate the client doesn't trust. |
| Authentication | Are the credentials accepted. | A wrong password, an expired token, or the wrong auth method for what the server now expects. |
| Database select | Does the named database, project or warehouse exist and respond. | A misspelled database name, or a paused warehouse. |
| Permissions probe | Can the account do what the connection needs to do. | Missing role grants, like BigQuery Data Viewer or Databricks warehouse access. |
Reading the panel
- Open the failed connection and look at the Diagnostics panel.
- Find the first stage marked fail, scanning top to bottom. Everything after it shows skip, which is expected, not a second problem.
- Read the plain-language message under that stage. It names the likely cause, not just an error code.
- Expand Details if you need the raw driver error underneath the plain-language summary.
- Use Copy message for a one-line summary, Copy full details or Copy as JSON for the whole run, or Save Diagnostics… to write it to a file.
- Fix the failed stage, then click Test again. Diagnostics re-runs all six stages from the top.
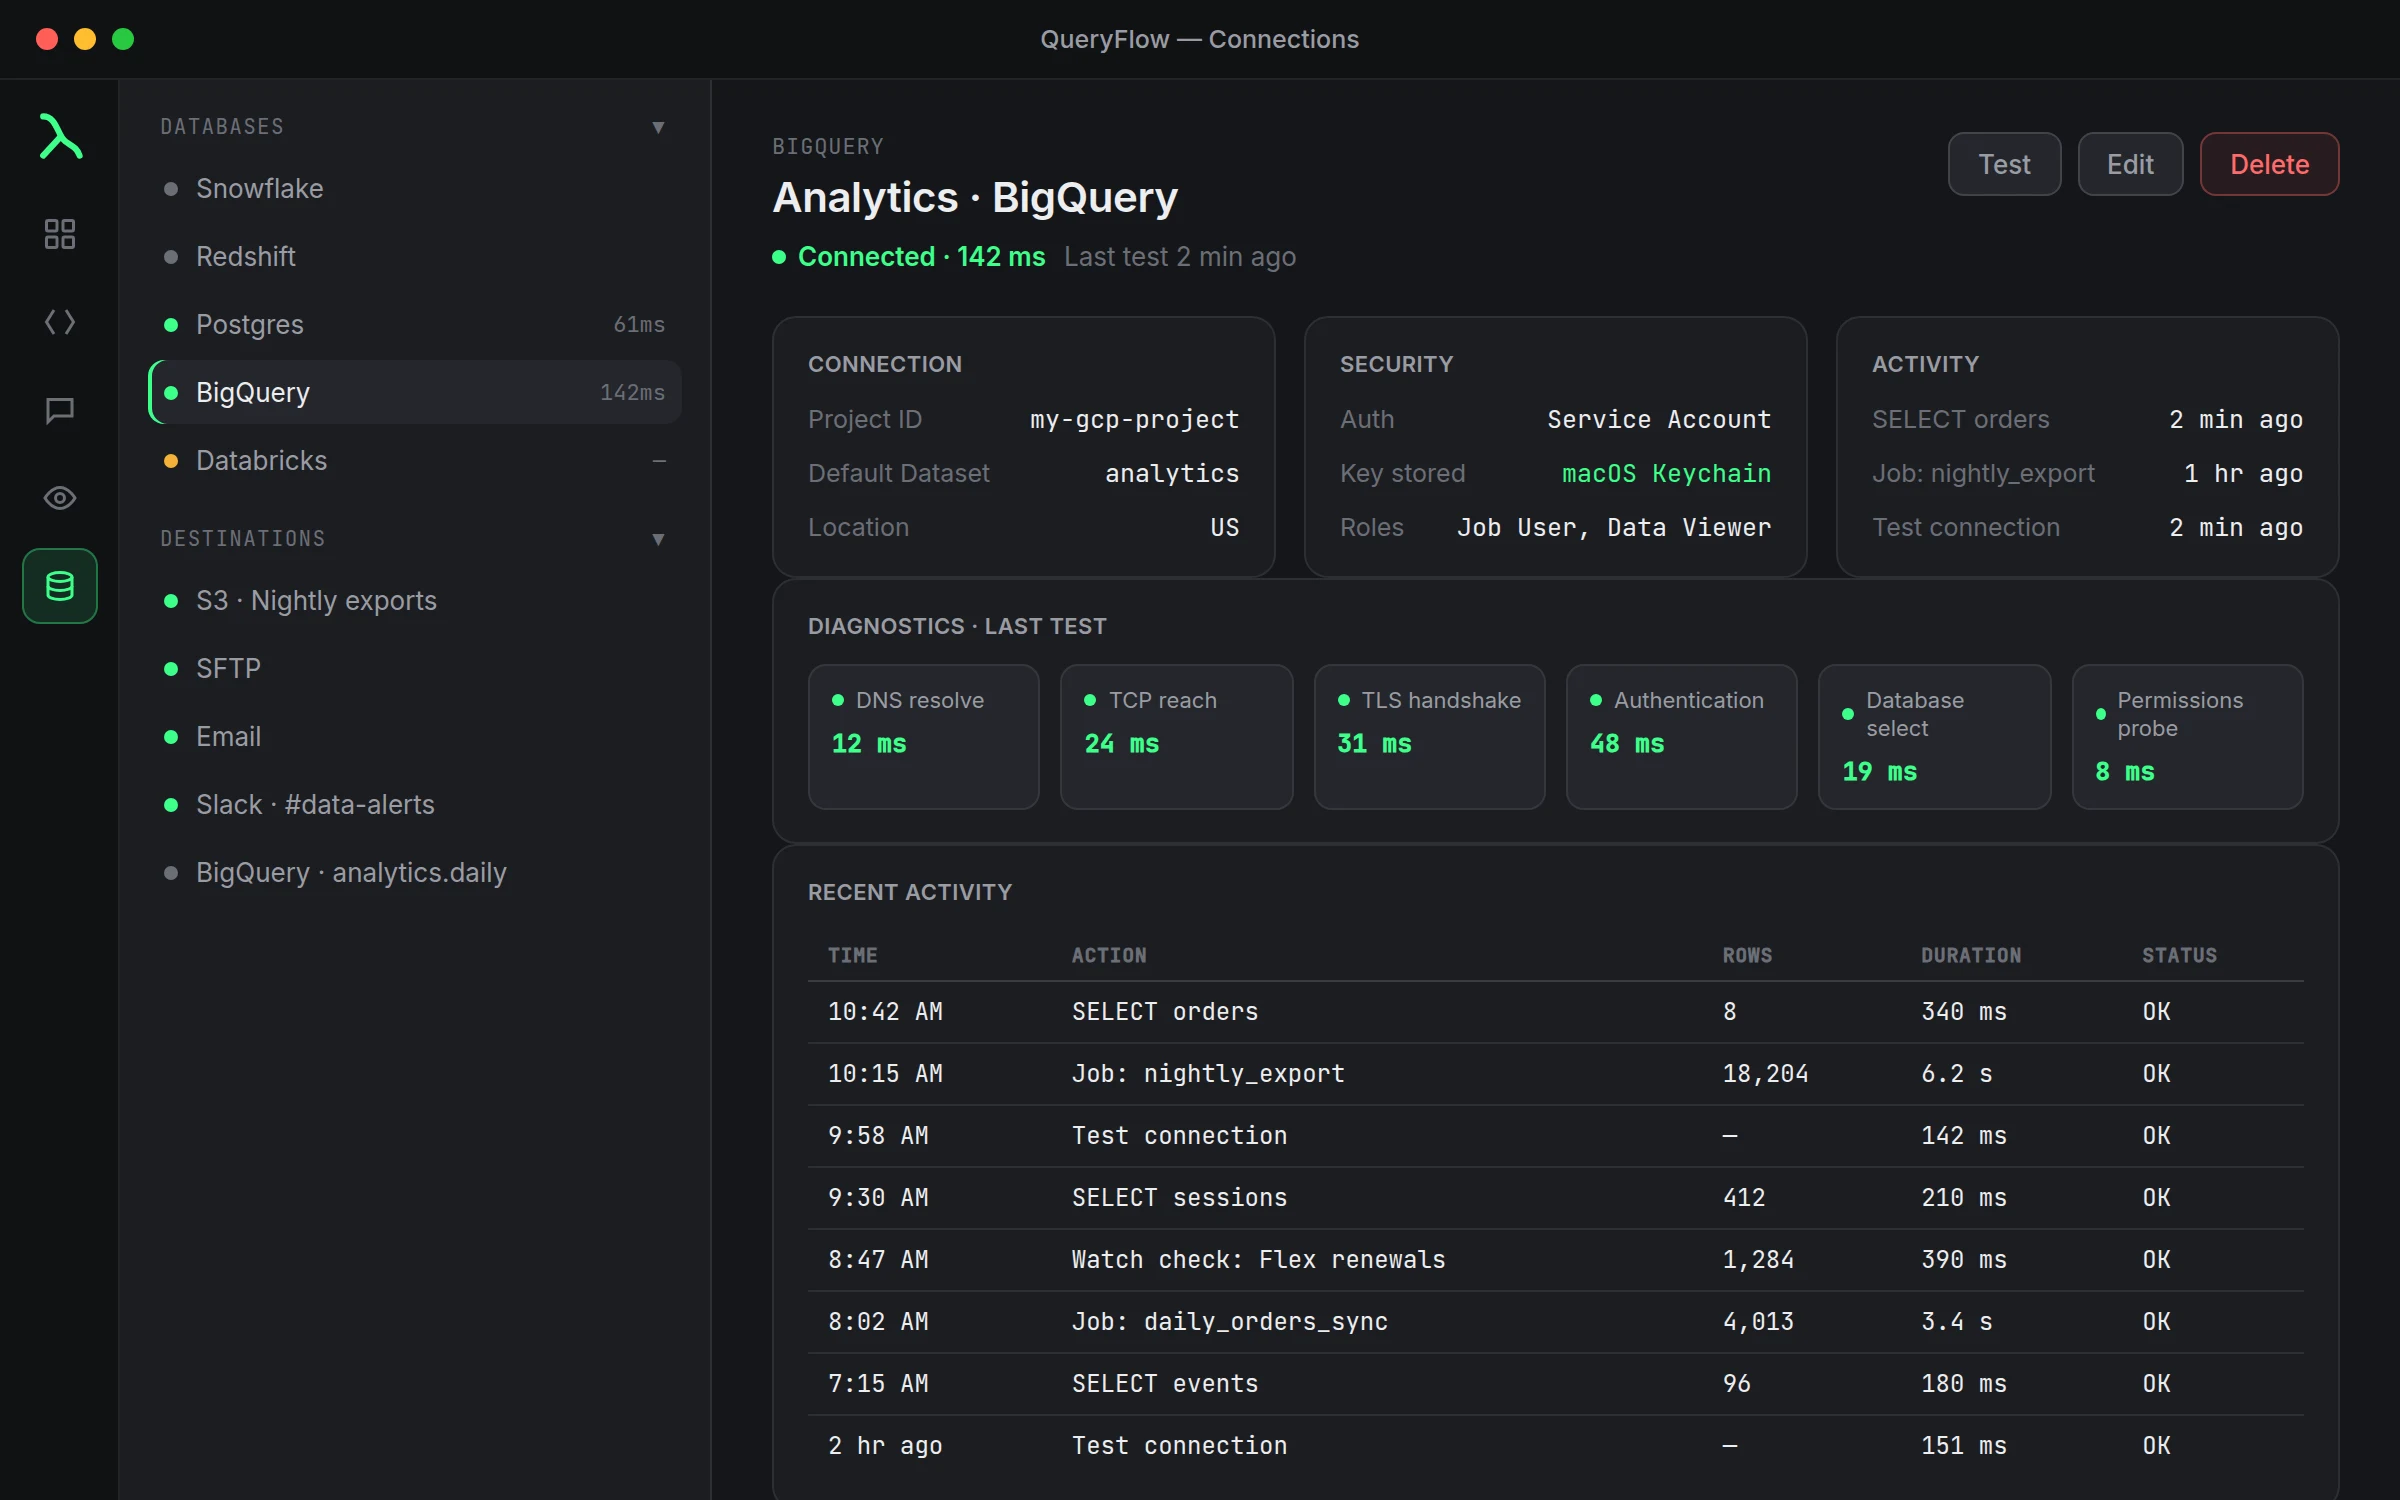
A worked example
Say a Databricks connection that worked yesterday fails today. DNS resolve passes, TCP reach passes, TLS handshake passes. Authentication fails, with the message "Databricks rejected the credentials." Everything before Authentication worked, which already rules out a network problem, so the fix is a fresh personal access token, not a firewall rule or a hostname check. That's the value of the stage order: you know exactly which half of the problem space to ignore.
What Permissions probe actually checks
Permissions probe is the stage most people skip past because everything above it already passed, which is exactly why it's worth reading closely. On BigQuery it typically means the account is missing BigQuery Job User or BigQuery Data Viewer; add BigQuery Data Editor too if the connection needs to write. On Databricks it usually means the user or service principal hasn't been given access to the specific SQL warehouse, which is a separate grant from having a Databricks account at all. Both failures look identical from the outside, "connected, but denied," so the plain-language message under this stage is doing real work telling you which role to go add.
Why this is not the same as the connection-failed guide
The database connection failed troubleshooting guide covers the same six-link idea in general terms, for any SQL client, including ones with no automated diagnostics at all: run nslookup yourself, run nc -zv yourself, check sslmode by hand. This page is about the panel QueryFlow already ran for you and what its output actually means, plus the copy and save actions for handing a failure to someone else, like a teammate who administers the warehouse or QueryFlow support.
Check it worked
Click Test again after making a change. All six stages should read pass, the status dot turns green, and the header shows "Connected" with a latency figure.
If something still goes wrong
| If you see | Fix |
|---|---|
| Can't resolve [host]. | Check the hostname, or connect to your VPN. |
| [host] resolved to IPv6 (::1) only. | Use 127.0.0.1 instead of localhost. |
| TCP reach fails or times out | Check firewall rules, host and port. |
| Authentication stage fails | Re-enter the password or token, and confirm the account has access. |
Frequently asked
Does Diagnostics work the same for every connector?
Yes, the same six stages run for Snowflake, BigQuery, Databricks and everything else. What differs is which stage tends to fail for a given provider, not the panel itself.
Why do the stages below the failure show 'skip' instead of running anyway?
Each stage assumes the one before it succeeded. Running Authentication against a host that never resolved would just produce a confusing second error, so the panel stops.
Can I send a Diagnostics result to someone else without a screenshot?
Yes. Copy as JSON or Save Diagnostics both capture the full six-stage run in a format that's easier to read and paste than a screenshot.
Is this the same troubleshooting order as the connection-failed guide?
The underlying order (DNS, network, TLS, login, database, permissions) is the same idea either page uses. This one is about QueryFlow's own panel running those checks for you; the other is a manual version for any client.